
B.C.’s bleak economic performance and outlook
The latest GDP growth by industry data released by Statistics Canada offers a sobering picture of B.C.’s economic health.[1] Adjusted for population, the provincial economy has shrunk over the past two years (Figure 1). Real output (gross domestic product, GDP) per capita fell by 1.8% in 2024 – the second-worst performance among the provinces – following a decrease of 0.8% in 2023. In layman’s terms, falling GDP per capita means B.C.’s households and businesses are generating less total income, per head of population, that they were in 2022. The “economic pie” is shrinking.
By comparison, over the longer term (1997-2024), B.C.’s real GDP per capita has grown at a compound annual growth rate (CAGR) of +1.3% per annum.[2] In other words, B.C.’s population-adjusted economic growth over 2023-24 was around 2-3% per annum below its historical average.
B.C.’s performance looks somewhat more favourable when considering the past five years rather than the past two. Real GDP per capita growth averaged +0.2% per annum over 2019-24, still a paltry figure by historical standards, but better than most other provinces. B.C.’s relative outperformance in part reflects a multi-year lift from four once-in-a-generation mega capital projects: Trans Mountain, Site C, LNG Canada, and Coastal Gas Link. However, as those projects started to wind down after 2022, B.C.’s economy has tanked. This is largely because of a lack of strength across the private sector to fill the post-mega-project void.
Figure 1

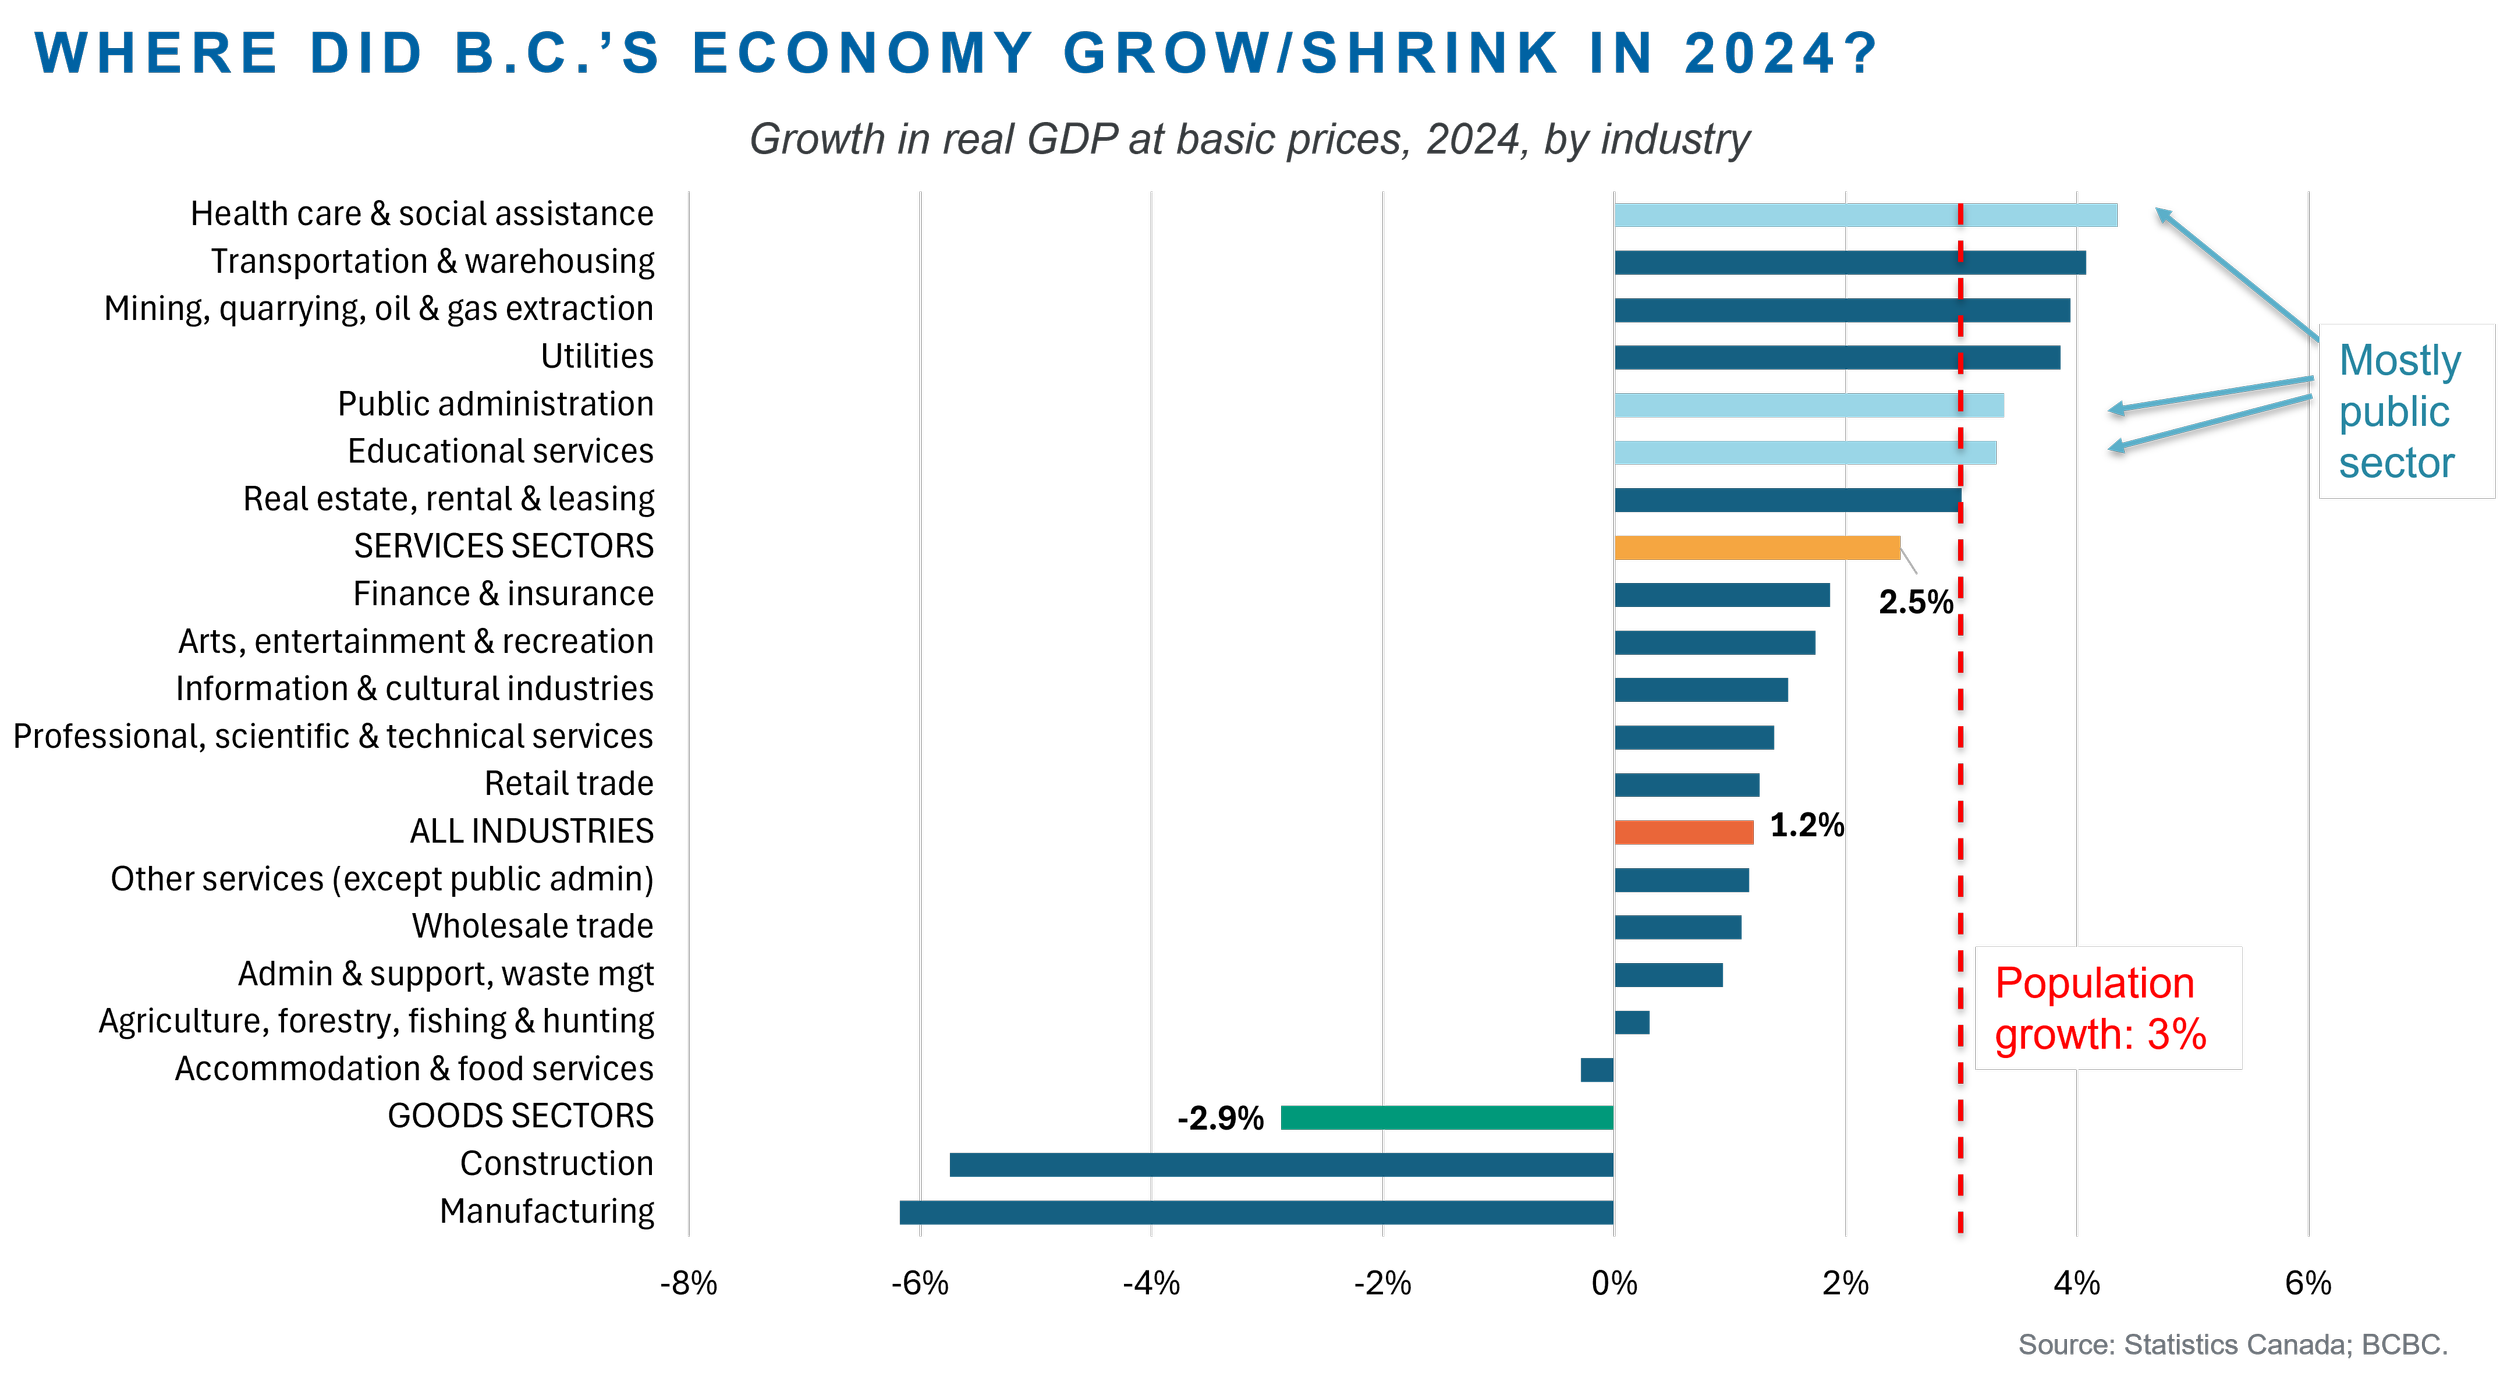
Where did B.C.’s economy grow or shrink in 2024?
Figure 2 shows output growth across industries in 2024. Population growth, which was a staggering 3% last year, is also shown in red. This is important because in principle, if the province’s population expands by 3%, economic activity should be at least 3% larger because there are 3% more potential consumers and workers. However, that was not the case. B.C.’s GDP growth in 2024 was only 1.2%, despite there being 3% more people. As discussed above, this means that in per-person terms the economy shrank by 1.8% (i.e., 1.2% GDP growth minus 3.0% population growth). To put it another way, B.C.’s population grew much faster than the production of goods and services, leading to a decline in average living standards.
Only six industries grew faster than population growth: health; transport; upstream natural resource production, utilities, public administration; and education. Note that health, public administration, and education are mostly public sector activities. Thus, only three of the top six industries were in the private sector. All other private sector industries grew slower than the population in 2024. Output in two industries, construction and manufacturing (including wood manufacturing), contracted outright. Overall, the picture is one of broad-based weakness across the private sector, and an economy propped up by growth in the public sector and population.
Figure 2
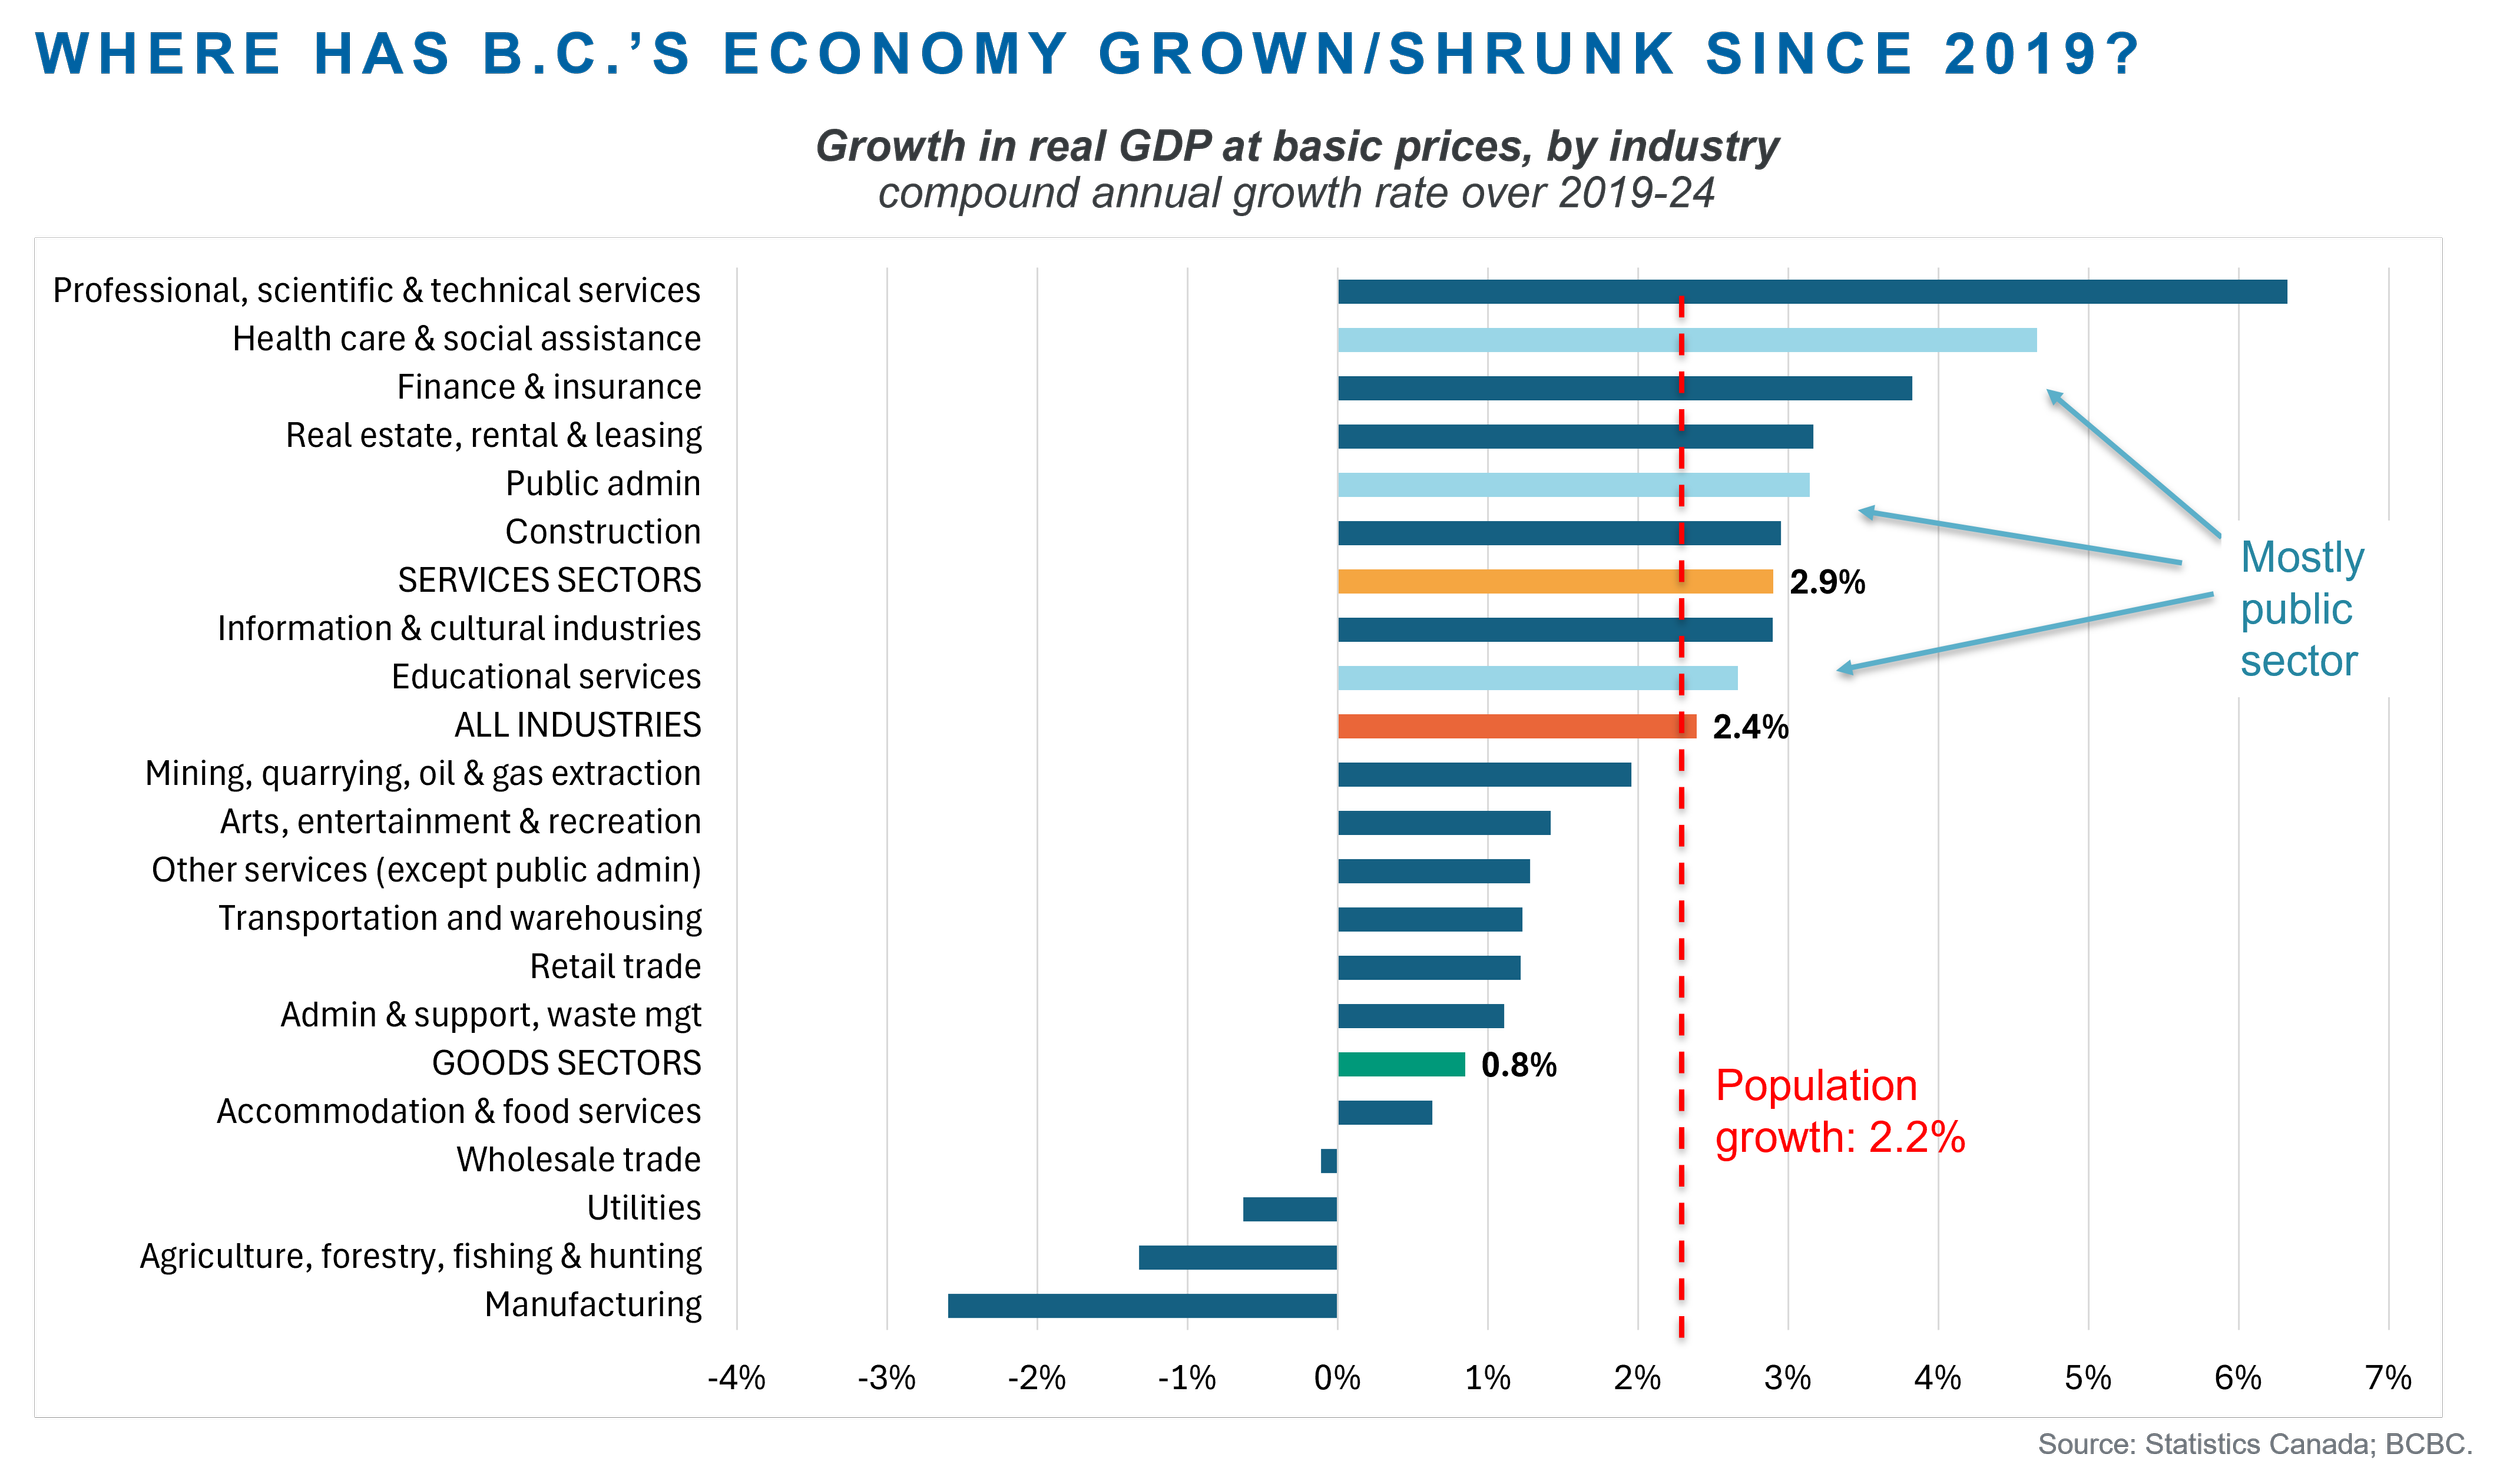
Where has B.C.’s economy grown or shrank since 2019?
A similar pattern emerges over the past five years too (Figure 3). B.C.’s population expanded at 2.2% per annum over 2019-2024, while GDP barely kept up and grew at 2.4% per annum. As discussed above, this means that in population-adjusted terms, B.C.’s economy grew by a paltry +0.2% per annum (i.e., 2.4% GDP growth minus 2.2% population growth). That figure was only positive because of the lift from mega capital projects until 2022 after which projects began to wind down.
Once again, predominantly public sector industries grew faster than the population over 2019-24. Only a handful of private sector industries grew at or faster than the population: professional services; finance and insurance; real estate (including owner-occupied housing), rental and leasing; and construction. All other private sector industries grew slower than the population. Four industries shrank outright: wholesale trade; utilities; agriculture, forestry (timber harvesting), fishing and hunting; and manufacturing (including wood manufacturing). Overall, taking a five-year perspective, the picture is the same: activity in the private sector is broadly weak, and the economy is mostly being propped up by growth in the public sector and population.
Figure 3
B.C. budget expects further deterioration over 2025-26
An improvement in B.C.’s prospects over the next two years appears unlikely. The 2025 B.C. Budget, released on March 4, included a scenario where the U.S. imposes tariffs on Canada and Mexico. The U.S. implemented tariffs on the same day the provincial budget was released. In the budget’s tariff scenario, provincial GDP growth stalls at 0.3% in 2025 and 0.8% in 2026 (Figure 4). [3]
The current trade environment, however, differs from the one modelled in the budget. Canada’s effective tariff rate remains low at 2.3%, and approximately 90% of Canadian exports to the U.S. are currently entering tariff-free under USMCA as exporters meet compliance requirements (RBC, 2025). On the other hand, President Trump’s tariffs, and threats of them, on a wide range of countries may have contributed to a global slowdown in trade and investment. This was not part of the budget’s scenario planning.
Figure 4

Conclusion
B.C.’s economic performance over recent years has been poor, especially when considered in population-adjusted terms. While it can be tempting to blame the province’s economic woes on President Trump’s policy agenda, our home-grown challenges are evident in the data long before his inauguration on January 20, 2025.
B.C.’s economy until 2022 was lifted by several once-in-a-generation mega capital projects. Even so, average per capita GDP growth over 2019-2024 was barely positive and far below its historical average. As the mega projects wound down, there has been a lack of private sector activity to fill the void. The economy has been mostly been propped up by growth in the public sector and population, neither of which are sustainable.
The most pressing challenge facing policymakers is how to restore vibrancy to B.C.’s private sector. BCBC’s provincial policy recommendations on how to do so are here. The top three are:
Restore fiscal discipline – record deficits send a negative signal to businesses and workers about basing themselves in the province given that future taxes may need to be significantly higher to stabilise our fiscal situation;
Remove the provincial sales tax (PST) on capital inputs – the inefficient PST causes B.C. to have Canada’s highest effective tax rate on new capital investment;
Reduce the top personal income tax rate to below 50% – when workers can keep at least half of an extra dollar of income that they earn, it makes the effort to do so worthwhile. This would make it easier for businesses to retain and attract the skilled workers they need to base and expand their operations in B.C.
Nevertheless, a turnaround in the province’s economic fortunes over the next two years seems unlikely. President Trump’s tariff and other policies since his inauguration on January 20 look set to exacerbate our entrenched home-grown underperformance. The B.C. budget, tabled on March 4, was not expecting a turnaround in B.C.’s economic performance. The U.S. has subsequently imposed, or threatened to impose, tariffs on a wide range of countries leading to a global slowdown in trade and investment. Thus, B.C.’s GDP growth outlook for 2025 and 2026 may end up being revised lower. We will find out when the government releases its First Quarterly Report on the province’s fiscal situation in September.
[1] GDP by industry data is at basic prices, meaning that it excludes taxes and subsidies on production and imports.
[2] Note that this “typical” growth rate would be higher if we excluded the 2008-09 and 2020-21 recessions.
[3] Figure 4 shows the Budget’s forecasts for growth in real GDP at market prices. This concept differs slightly from GDP at basic prices (i.e., GDP by industry) as it includes taxes and subsidies on production and imports.