
What’s driving Metro Vancouver’s spectacular hikes to development cost charges?
In a recent report, we found that runaway growth in municipal operating spending has been a key contributor to declining affordability in B.C. over the past decade or so. We also considered Metro Vancouver’s track record for operating spending. Metro Vancouver is the regional government responsible for sewer, water and solid waste for around 3 million of B.C.’s residents.
Our report found that Metro’s operating expenditures grew by roughly 71% over 2013-23 – far outpacing inflation (28%) and population growth (21%). This gap represents about $275 million of “excess” spending over the period, or around $100 per capita (roughly $250 per household), reducing affordability for businesses and households in the region.
Let’s now consider Metro’s capital spending and how it is financed. Massive hikes to Metro’s development cost charges (DCCs), which help fund capital spending, have raised concerns about the impact on new housing costs. The Urban Development Institute (UDI) estimates that government taxes and fees, including DCCs, make up around 29% of the cost of a new condominium unit in Vancouver in 2023, compared to around 12-15% in Kelowna (UDI, 2023).
What are development cost charges (DCCs)?
Regional government DCCs are one-time fees levied on new development projects to fund new infrastructure such as drinking water, sewerage, drainage and regional parkland. They are collected at the time of permit issuance or subdivision approval. Regional DCCs are one of several revenue-raising tools used to finance capital expenditures, alongside borrowing, utility rates, and property tax requisitions, but they do not fund operating expenses.
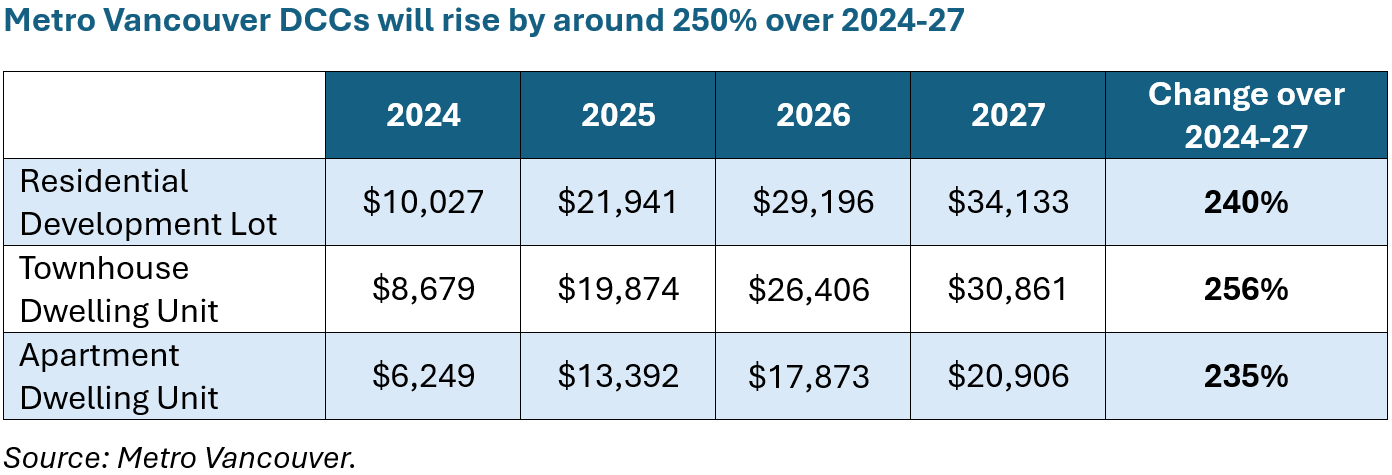
Regional government DCCs are an additional layer on top of DCCs levied by municipalities. Metro’s planned DCC increases over 2024-27 are notable as they are around 250% (Table 1). By comparison, overall CPI inflation over the period is expected to be around 6-9%.
Table 1
What’s driving the increase in Metro’s DCCs?
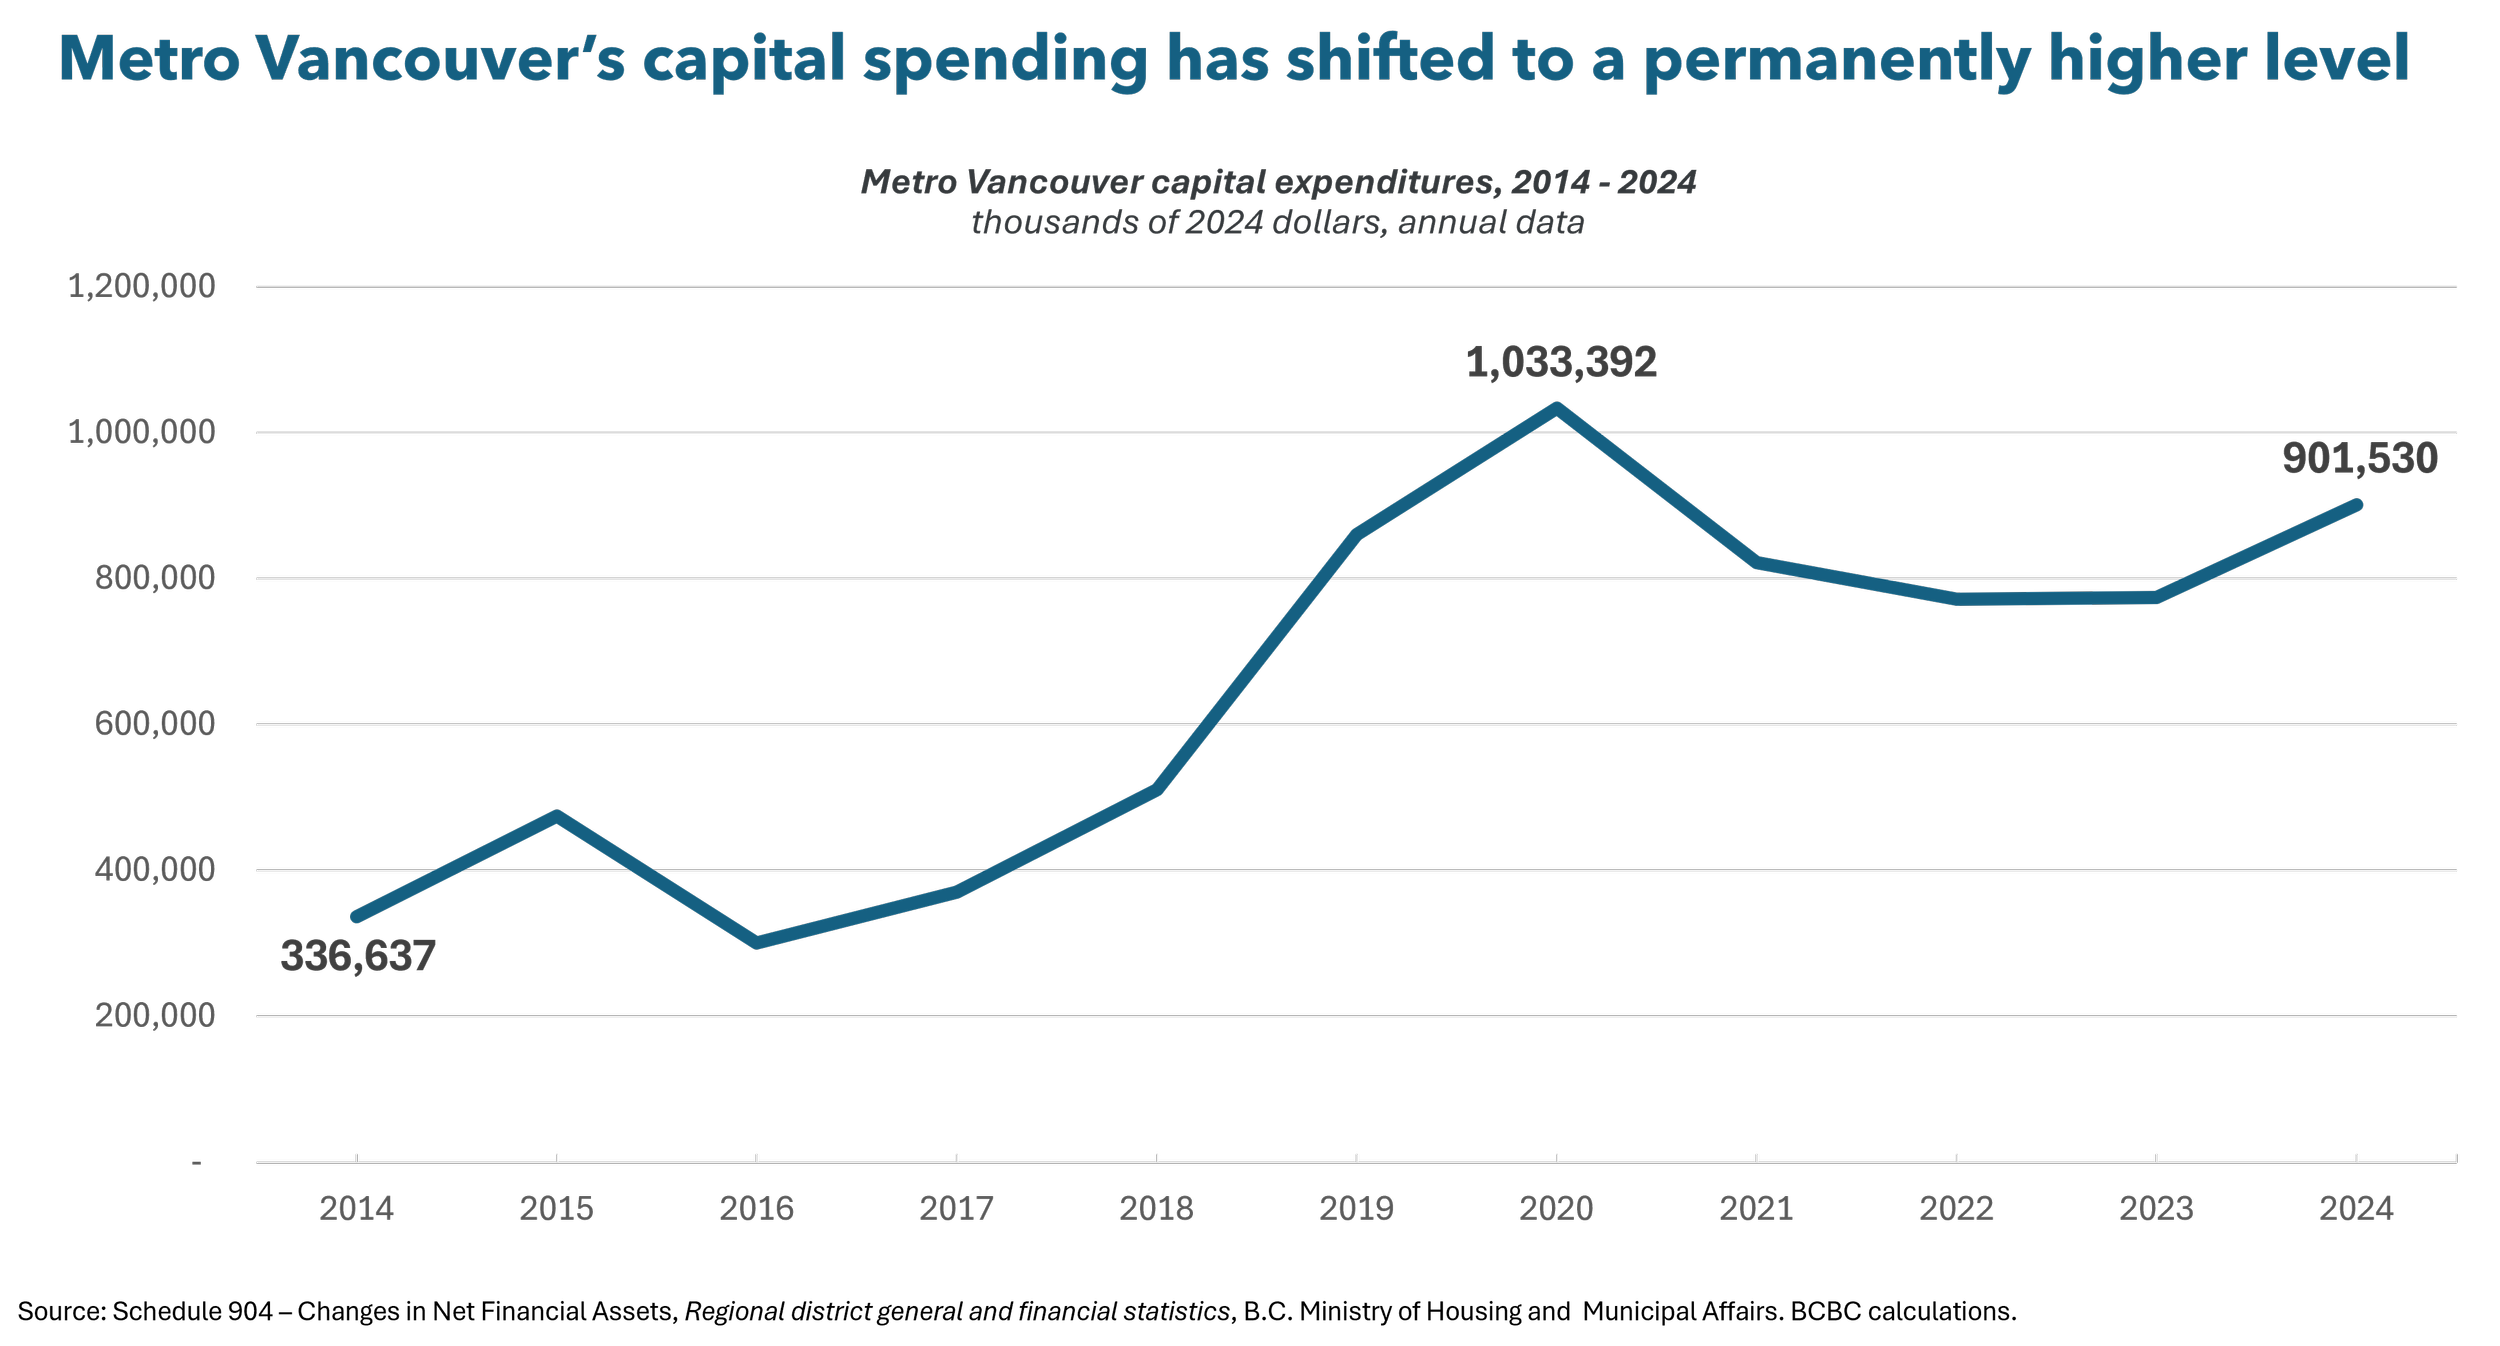
We examined capital expenditures alongside DCC revenues over 2014-2024 using data from the B.C. Ministry of Housing and Municipal Affairs’ Regional district general and financial statistics.{1} Prior to 2019, Metro Vancouver’s capital spending typically ranged between roughly $300-$510 million per annum in real (inflation-adjusted) 2024 dollars (Figure 1). Since then, real capital expenditures have increased sharply and persistently to around $700 million to $1 billion. The significant increase in Metro’s capital spending may help explain the pressure on DCCs.
Figure 1:
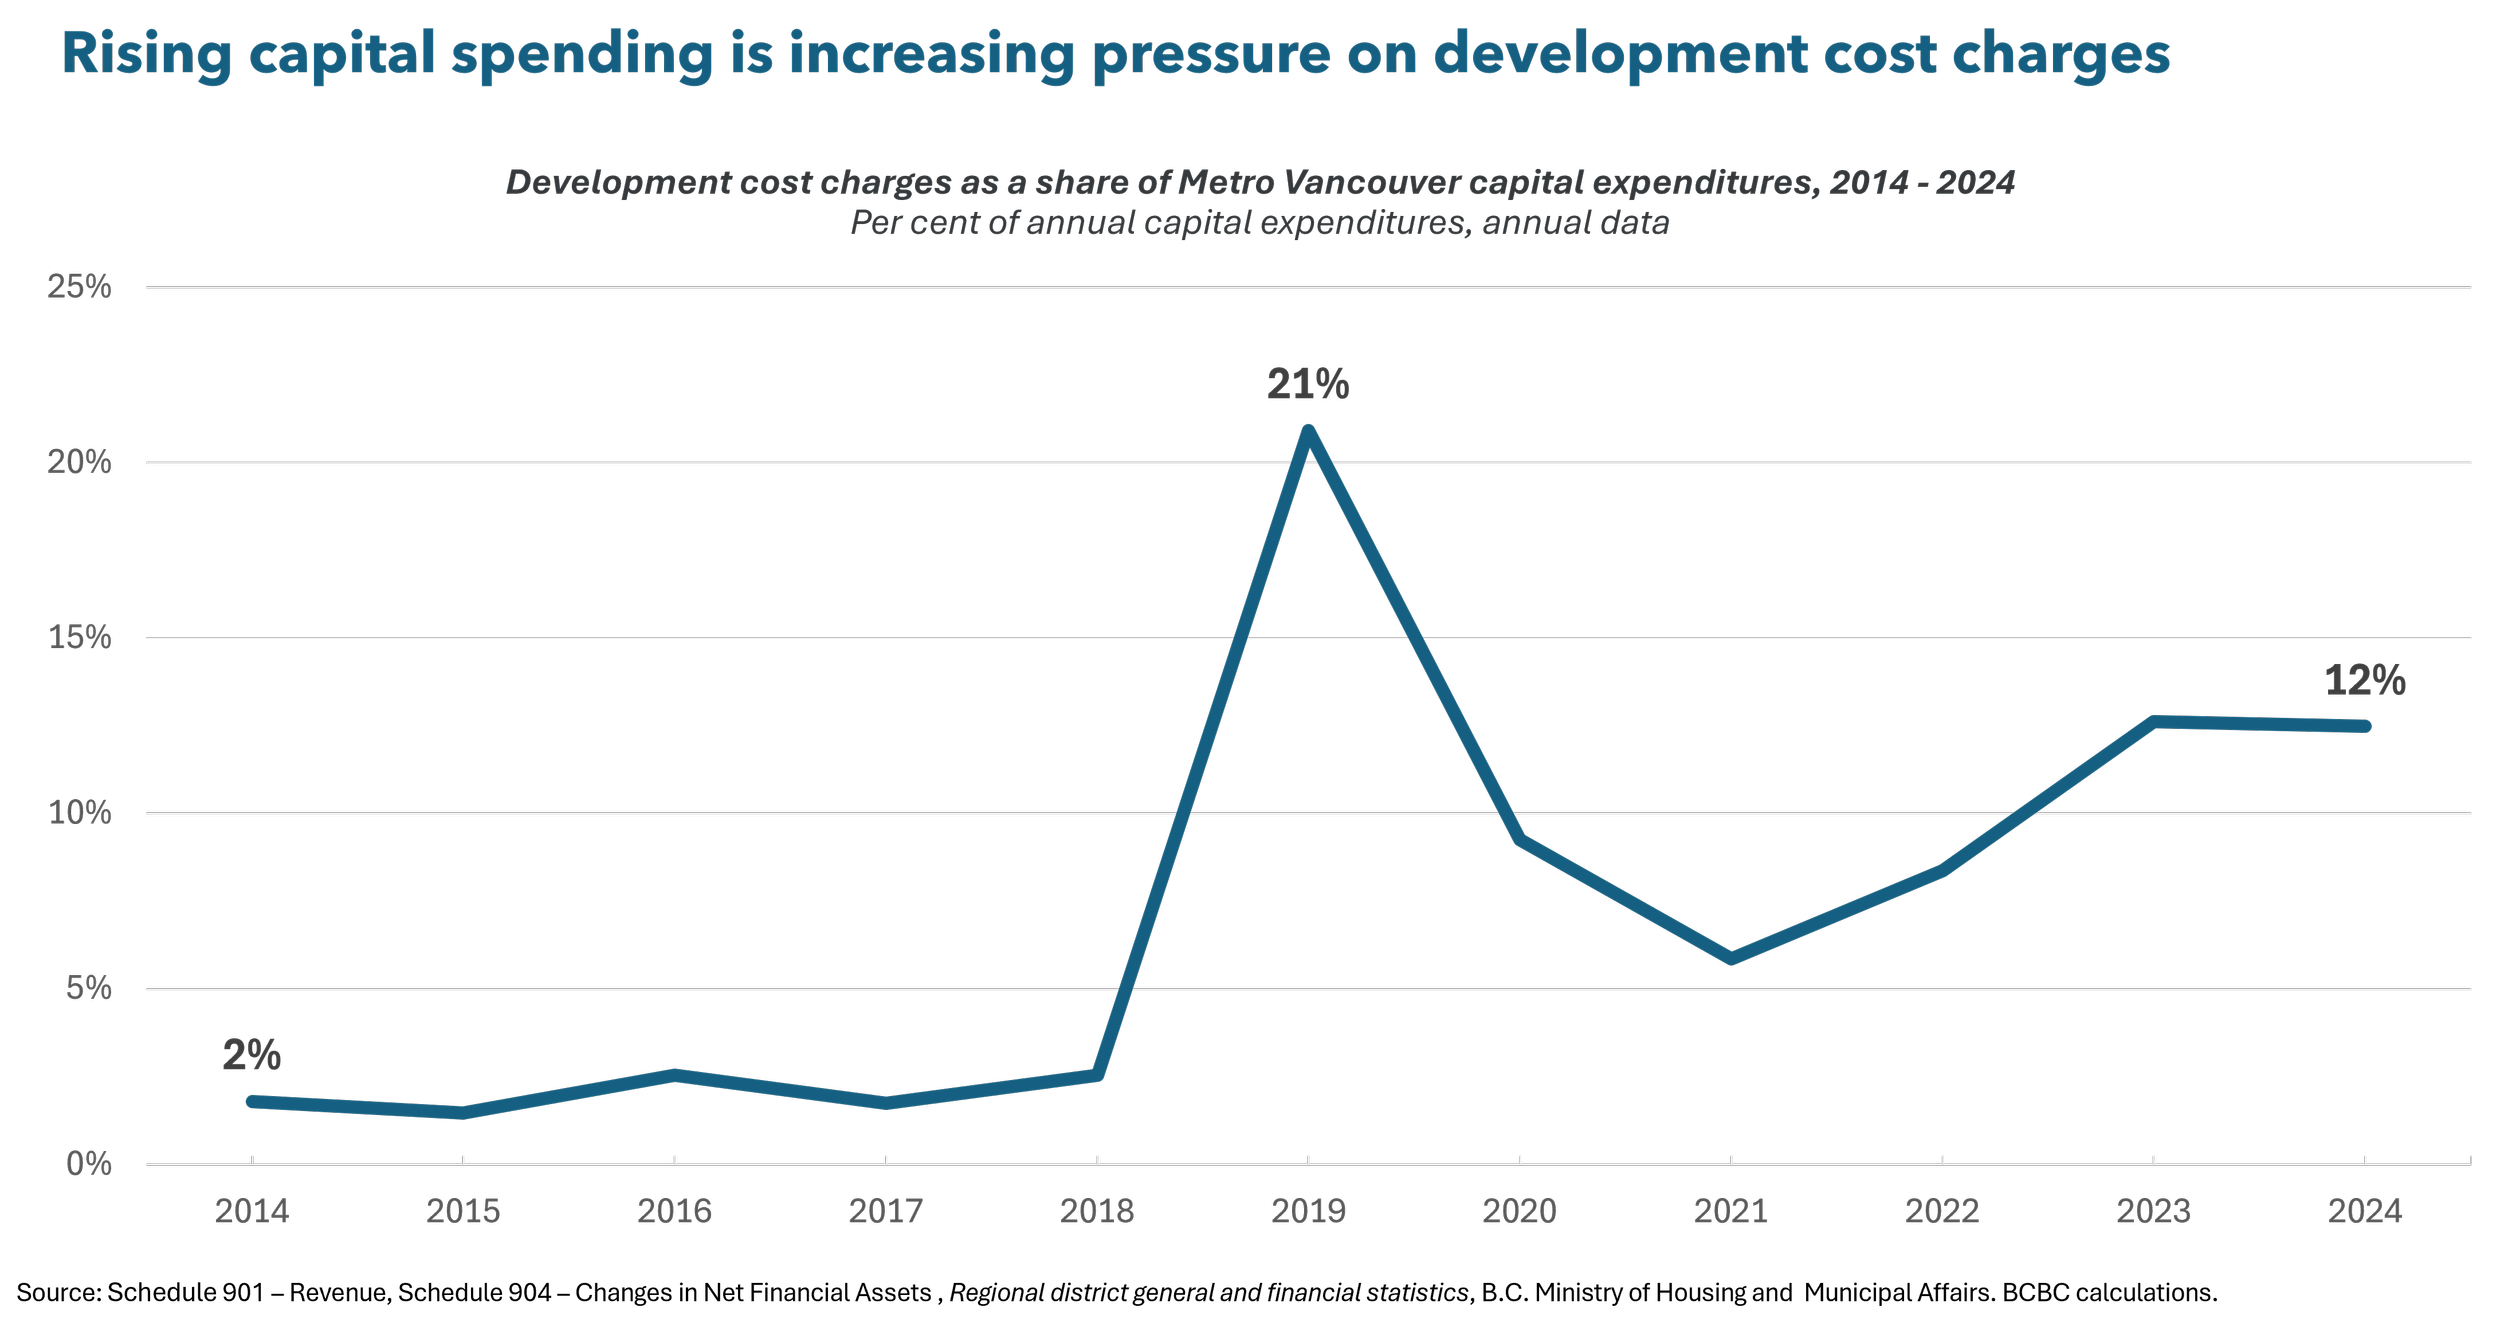
Over the same period, Metro’s DCC revenues have risen, particularly since 2019. From 2014 to 2018, DCC revenues averaged roughly $6-$13 million per year in real 2024 dollars.{2} Thereafter, they settled into a much higher range of $50–$110 million per year. Consequently, DCC revenues now represent around 10%-12% of capital spending compared to around 1%-3% before 2019 (Figure 2). In other words, since 2019 there has been an increasing reliance on regional DCC revenues to fund Metro’s capital budget.
Figure 2
It’s time to reconsider Metro Vancouver’s governance
Metro Vancouver’s capital spending has increased, and as 2024, DCC revenues were being used to cover about four times the share of capital costs they did in pre-2019 years. That burden will likely rise further over 2024-27 as regional DCCs are hiked by around 250%. This raises the question of whether new home buyers should bear an increasing share of the cost of regional infrastructure, over and above the cost of new infrastructure.
It also raises the broader question about fiscal discipline at Metro Vancouver. As noted earlier, Metro’s operating spending has risen much faster than population growth or inflation can justify. Although Metro’s operating budget will exceed $2 billion by 2030, there is no direct democratic accountability and only perfunctory provincial oversight.
Similarly, Metro’s capital projects have suffered massive cost overruns, the most notorious example being the $3.2 billion (451%) cost overrun and decade-long delay for the botched North Shore Wastewater Treatment Plant. An even larger capital project of around $6 billion looms in the proposed upgrade to the Iona Island Wastewater Treatment Plant in Richmond by 2030. Given the mismanagement of the North Shore project, there is little reason for the public to have confidence that Metro can competently deliver an even larger and more complex regional capital project.
All of the above indicates that it is time for the provincial government to reconsider the governance structure of Metro Vancouver, given its scale, impact on affordability in the region, lack of expertise in managing complex capital projects, and lack of direct democratic accountability to taxpayers. At a minimum, the province should expand the powers of the B.C. Auditor General to include oversight of municipal and regional governments. This would help identify gaps, duplication, and wasteful spending (i.e., spending measured against objectives and outcomes), and thereby encourage greater fiscal discipline and accountability in municipal and regional governments.
Without stronger accountability for its operating and capital spending decisions, excessive hikes in Metro’s property taxes, DCCs, and other fees are likely to continue to undermine affordability in the region.
{1} Capital expenditures are taken from Schedule 904 – Changes in Net Financial Assets and reflect spending on the acquisition, construction, and development of tangible capital assets including land, buildings, engineering structures, equipment, and works in progress. DCC revenues are drawn from Schedule 901 - Revenue under developer contributions; beginning in 2019, this schedule reports “developer and other contributions/donations.”
{2} In 2019, DCC revenues spiked to approximately $180 million. The one-year spike coincides with a change in Schedule 901 reporting, which broadened the category from “developer contributions” to “developer and other contributions/donations,” limiting the ability to fully disaggregate the components of the spike using summary data alone.